I explored how grey and white matter structure interact during development in adolescents.
Among the many established assumptions in neuroimaging, one rarely questioned is the division of the brain into grey and white matter. Although this division may seem defensible given their unique structures, it has led to a fragmented literature in which researchers conduct brain-wide association studies that focus solely on either grey matter or white matter metrics. The choice to examine one implicitly assumes that the information captured by that metric provides an exhaustive reflection of the whole brain. However, the nature of the associations between grey and white matter (metrics) remains unclear, as does the extent to which they are uniquely related to behavioural and environmental factors. In my PhD, I questioned this division: should we consider grey and white matter as two separate structures, or should we consider them as two components of the same brain structure? From this perspective, I investigated how the integration of both grey and white matter metrics provides a more comprehensive view of brain development and its associations with cognition and adverse experiences. Finally, I argued that only by considering their parallel development and their shared and distinct cellular mechanisms will we begin to comprehend the mechanisms underlying brain development.
Throughout this PhD, I focused on five core projects around this theme:
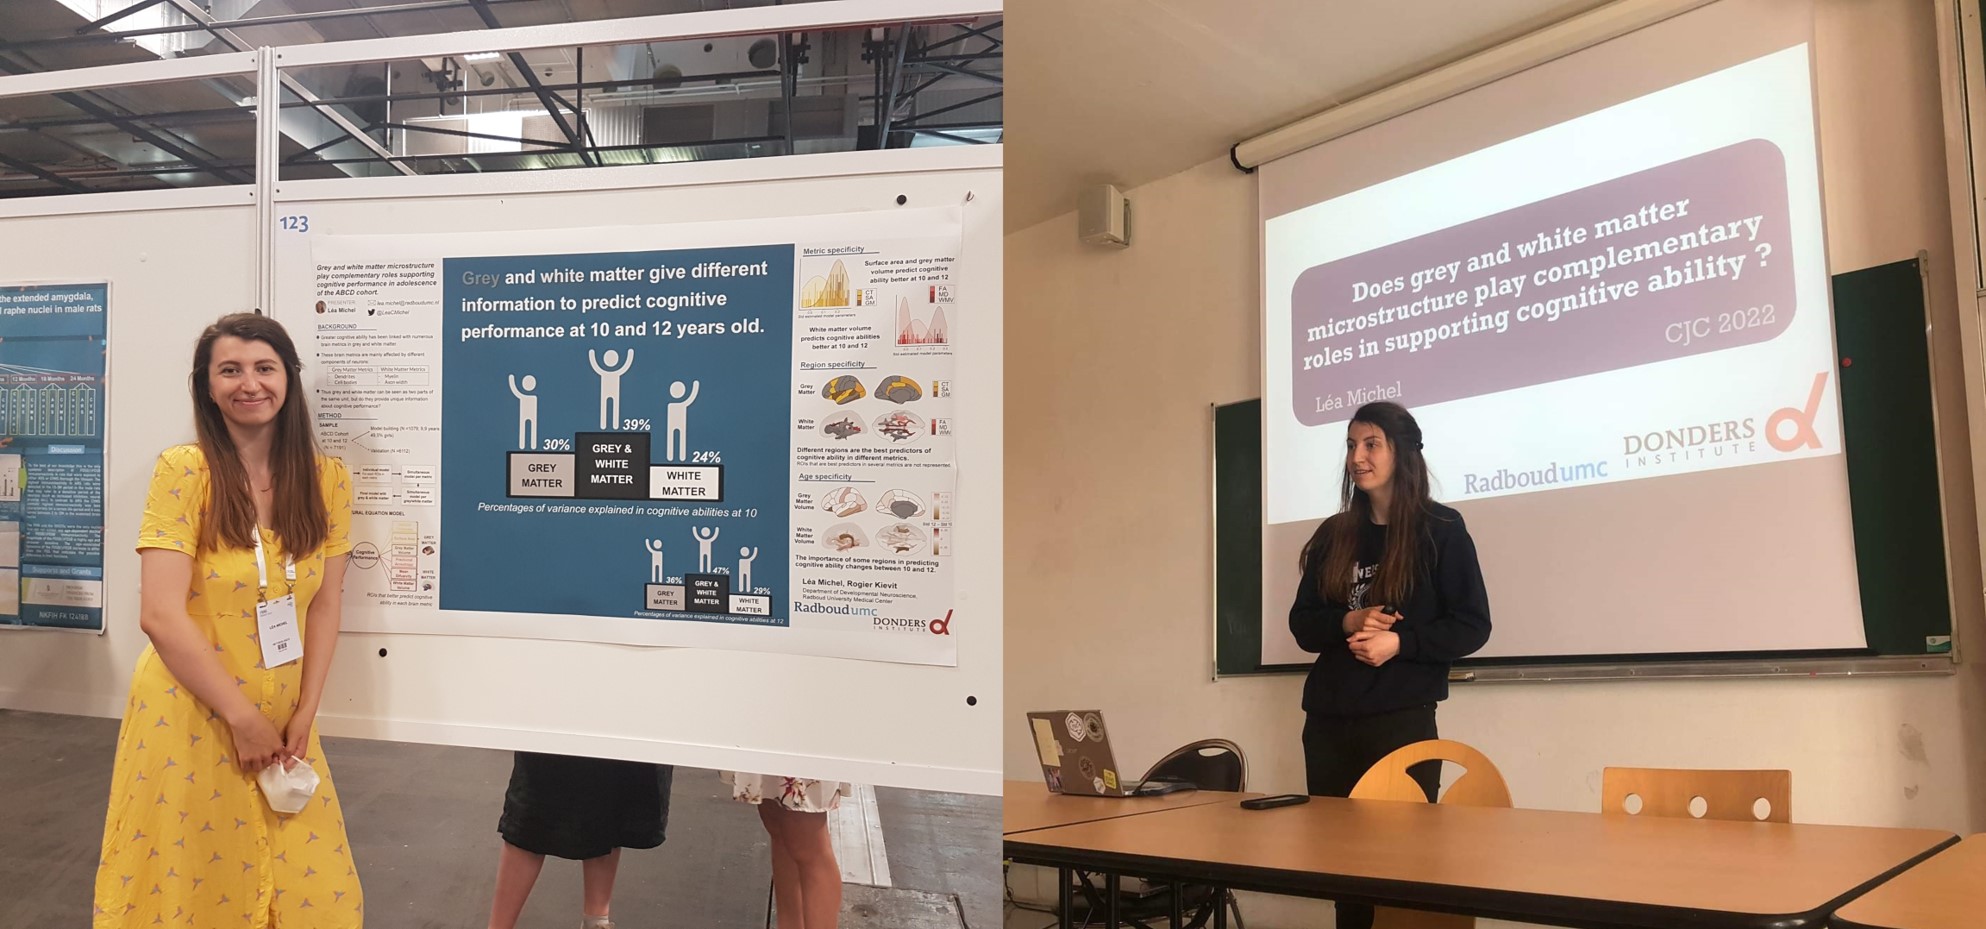
1. How grey and white matter structure bring partially overlapping information to the prediction of cognitive performance in children.
To compare the roles of grey and white matter in supporting cognitive performance, we used regularised structural equation models to predict cognitive performance from grey and white matter metrics. Specifically, we compared how grey matter (volume, cortical thickness, and surface area) and white matter measures (volume, fractional anisotropy, and mean diffusivity) predict individual differences in cognitive performance. The models were tested in 11,876 children (ABCD Study, 5680 females; 6196 males) at 10 years old. We found that grey and white matter metrics bring partly non-overlapping information to predict cognitive performance. The models with only grey or white matter explained respectively 15.4% and 12.4% of the variance in cognitive performance, while the combined model explained 19.0%. Zooming in, we additionally found that different metrics within grey and white matter had different predictive power, and that the tracts and regions that were most predictive of cognitive performance differed across metrics. These results show that studies focusing on a single metric in either grey or white matter to study the link between brain structure and cognitive performance are missing a key part of the equation.
2. The neural scars of adversity: how do different kinds of adversity predict the development of grey and white matter structure in two longitudinal neuroimaging cohorts?
We explored which brain structure (grey or white matter) is more sensitive to early adversity (maltreatment). This study investigates whether differences in trajectories of grey and white matter development during adolescence can be explained by exposure to different types of adversity. We applied the Adverse Adolescent Experiences Framework (Pollmann et al., 2025) categorising adversity into four levels: Intrapersonal (e.g., accidents), Caregiver (e.g., emotional neglect), Peer (e.g., bullying), and Community (e.g., neighbourhood safety). Exposure to each of the four factors was estimated through principal components analyses. We analysed two large longitudinal datasets: the Adolescent Brain Cognitive Development study (~12,000 adolescents measured at ages 10, 12, and 14) and the IMAGEN study (~1,400 adolescents measured at ages 14, 19, and 22). Using latent growth curve models, we captured individual differences in brain development by estimating baseline levels (intercepts) and rates of change (slopes) for total grey matter volume and mean white matter fractional anisotropy. In both cohorts, we found significant interindividual variability in baseline levels and rates of change for both grey matter volume and fractional anisotropy. Caregiver, Peer, and Community adversities were negatively associated only with the intercepts of grey matter volume and white matter fractional anisotropy. Importantly, adversity was differentially linked to grey and white matter trajectories. In ABCD, Peer and Community adversities were more strongly associated with grey matter volume intercepts. In contrast, in IMAGEN, Caregiver adversity was more strongly linked to white matter fractional anisotropy intercepts. This suggests that adversity has unique associations with grey and white matter, rather than exerting a uniform influence on brain structure. By demonstrating that different environments generate distinct biological associations with brain maturation, this work underscores the need to consider both grey and white matter when assessing the neurodevelopmental pathways to outcomes across the lifespan.
You can see the results on the poster or the flash talk from the Flux Congress in 2025.
3. The longitudinal development of grey and white matter metrics in typical development: the influence of cognitive performance
We assessed how longitudinal development of grey and white matter unfolds in typical development. In our study, we investigated the co-development of cortical grey matter volume and white matter fractional anisotropy across the 12-wave HUBU cohort (90 typically developing individuals). Using generalised additive mixed models to characterize changes in these metrics between the ages of 7 and 22 years, we explored the associations between rates of change to better understand the co-development of grey and white matter. Rates of change in cortical grey matter volume were positively correlated across the entire cortex, indicating a globally coherent pattern of cortical development. In contrast, changes in fractional anisotropy showed heterogeneous correlations across tracts, suggesting regional heterogeneity in white matter development. Next, we examined the correlation patterns between the development of cortical grey matter volume and white matter fractional anisotropy. Contrary to our expectations, no significant correlations remained after false discovery rate (FDR) correction, suggesting largely independent developmental patterns for white and grey matter, and/or small individual differences in the rate of change. The unexpected independence between the rates of change of grey and white matter suggests that these properties, although biologically related, may develop more independently than previously thought. This study contributes to the existing literature on brain structure development, emphasising the necessity of analysing trajectories for both grey and white matter together to comprehensively understand the biological mechanisms underlying brain development.
You can see the results on this presentation from a lab meeting in 2026.
4. The interplay between brain and behaviour during development: A multisite effort to generate and share simulated datasets
One of the challenges in the field of neuroimaging is that we often lack knowledge about the underlying truth and whether our methods can detect developmental changes. To address this gap, five research groups around the globe created simulated datasets embedded with their assumptions of the interplay between brain development, cognition, and behavior. Each group independently created the datasets, unaware of the approaches and assumptions made by the other groups. Each group simulated three datasets with the same variables, each with 10,000 participants over 7 longitudinal waves, ranging from 7 to 20 years-of-age. The independently created datasets include demographic data, brain derived variables along with behavior and cognition variables. These datasets and code that were used to generate the datasets can be downloaded and used by the research community to apply different longitudinal models to determine the underlying patterns and assumptions where the ground truth is known.
You can see the results in the paper: Sadeghi et al., 2025. The manuscript reflects an international collaboration among five teams of scientists, one of which I led.
Within my thesis, I extended this work to reproduce my findings from the previous project in the simulated samples. I examined how grey and white matter structures were modelled across the five groups, focusing on total grey matter volume and total white matter volume. The aim is to compare the associations between the trajectories of grey and white matter volumes, as a proxy for grey and white matter co-development. In addition to the published paper, in this chapter, I analysed all 15 datasets using a single analytical pipeline. I estimated total grey matter volume and total white matter volume independently for each dataset using generalized additive mixed models, following the methods in Chapter 4. We computed correlations between the intercepts and slopes of grey and white matter volumes in each dataset across the five cohorts. We also explored the assumptions about these associations made by each group in their scripts.
You can see the results on this presentation from a lab meeting in 2026.
5. Bridging the gap between structural MRI and cognition using in vivo histology
The underlying physiology of common structural MRI metrics like cortical thickness is still debated. We utilised a dataset combining resected cortical tissue from the middle temporal gyrus, MRI scans, and IQ measures from 68 patients requiring neurosurgical intervention for conditions affecting subcortical structures (e.g., epilepsy, tumours). By combining ex vivo histological metrics (total dendritic length, number of branch points, and cell body diameter), cortical thickness, and IQ scores within structural equation models, we assessed how histological metrics explain individual differences in IQ above and beyond MRI. Using a path modelling framework, we found that dendritic morphology predicts individual differences in IQ (total dendritic length: β = 0.486, p-value<0.001; number of branch points: β = 0.493, p-value<0.001) and in cortical thickness (number of branch points: β = -0.658, p-value<0.001). However, the relationship between histology and IQ was not mediated by differences in cortical thickness. Together, these findings indicate that MRI-derived cortical thickness does not fully capture the cellular mechanisms underlying individual differences in IQ, highlighting the value of integrating histological and neuroimaging measures to better understand brain-behaviour relationships.
You can see the results on the poster from the OHBM Conference in 2026.
If you want to know more, here is the video of the presentation I did for my department at the end of my second-year presenting three projects